Case Study with Python - Caeser Cipher, K-nearest neighbor
This post is part of the MOOC named ‘Python for research’ homework where I learned about Python by going through many case studies. This advance course is offered by Harvard through edx platform. I found this quite helpful to increase my Python skill.
import numpy as np
import pandas as pd
import random
import string
import matplotlib.pyplot as plt
Caeser Cipher
A cipher is a secret code for a language. In this case study, we will explore a cipher that is reported by contemporary Greek historians to have been used by Julius Caesar to send secret messages to generals during times of war.
The Caesar cipher shifts each letter of a message to another letter in the alphabet located a fixed distance from the original letter. If our encryption key were 1, we would shift h to the next letter i, i to the next letter j, and so on. If we reach the end of the alphabet, which for us is the space character, we simply loop back to a. To decode the message, we make a similar shift, except we move the same number of steps backwards in the alphabet.
Step 1
Create a string called alphabet consisting of the lowercase letters of the space character space ‘ ‘, concatenated with string.ascii_lowercase at the end.
alphabet =' ' + string.ascii_lowercase
print(alphabet)
abcdefghijklmnopqrstuvwxyz
Step 2
Create a dictionary with keys consisting of the characters in alphabet, and values consisting of the numbers from 0 to 26. Store this as positions
positions = {alphabet[i]: i for i in range(0,27)}
print(positions)
{' ': 0, 'a': 1, 'b': 2, 'c': 3, 'd': 4, 'e': 5, 'f': 6, 'g': 7, 'h': 8, 'i': 9, 'j': 10, 'k': 11, 'l': 12, 'm': 13, 'n': 14, 'o': 15, 'p': 16, 'q': 17, 'r': 18, 's': 19, 't': 20, 'u': 21, 'v': 22, 'w': 23, 'x': 24, 'y': 25, 'z': 26}
Step 3
defining a function encoding that takes a message as input as well as an int encryption key, key to encode a message with the Caesar cipher by shifting each letter in message by key positions.
def encoding(message, key):
    encoding_list = []
    for char in message:
        pos = positions[char]
        encoded_pos = (pos + key) % 27
        encoding_list.append(alphabet[encoded_pos])
    encoded_msg = "".join(encoding_list)
    return encoded_msg
# Let's call our encoding function

message = "my name is sheikh hanif"
key = 3

cipher = encoding(message, key)
print("The cipher text is: ", cipher)

# we can decode cipher as follow
decipher = encoding(cipher, -key)
print("The plaintext is: ", decipher)
The cipher text is:  pacqdphclvcvkhlnkckdqli
The plaintext is:  my name is sheikh hanif
KNN
In this case study, we will analyze a dataset consisting of an assortment of wines classified as “high quality” and “low quality” and will use the k-Nearest Neighbors classifier to determine whether or not other information about the wine helps us correctly predict whether a new wine will be of high quality.
Step 1
# importing dataset

data = pd.read_csv("data/wine.csv")
data.head()
| fixed_acidity | volatile_acidity | citric_acid | residual_sugar | chlorides | free_sulfur_dioxide | total_sulfur_dioxide | density | pH | sulphates | alcohol | quality | color | is_red | high_quality | |
|---|---|---|---|---|---|---|---|---|---|---|---|---|---|---|---|
| 0 | 7.4 | 0.70 | 0.00 | 1.9 | 0.076 | 11.0 | 34.0 | 0.9978 | 3.51 | 0.56 | 9.4 | 5 | red | 1.0 | 0.0 |
| 1 | 7.8 | 0.88 | 0.00 | 2.6 | 0.098 | 25.0 | 67.0 | 0.9968 | 3.20 | 0.68 | 9.8 | 5 | red | 1.0 | 0.0 |
| 2 | 7.8 | 0.76 | 0.04 | 2.3 | 0.092 | 15.0 | 54.0 | 0.9970 | 3.26 | 0.65 | 9.8 | 5 | red | 1.0 | 0.0 |
| 3 | 11.2 | 0.28 | 0.56 | 1.9 | 0.075 | 17.0 | 60.0 | 0.9980 | 3.16 | 0.58 | 9.8 | 6 | red | 1.0 | 0.0 |
| 4 | 7.4 | 0.70 | 0.00 | 1.9 | 0.076 | 11.0 | 34.0 | 0.9978 | 3.51 | 0.56 | 9.4 | 5 | red | 1.0 | 0.0 |
Two columns in data are is_red and color, which are redundant. Drop color from the dataset, and save the new dataset as numeric_data. To make sure this is applied to the column, you might try including the parameter axis=1!
numeric_data = data.drop("color", axis=1)
Step 2
We want to ensure that each variable contributes equally to the kNN classifier, so we will need to scale the data by subtracting the mean of each column and dividing each column by its standard deviation. Then, we will use principal components to take a linear snapshot of the data from several different angles, with each snapshot ordered by how well it aligns with variation in the data. In this exercise, we will scale the numeric data and extract the first two principal components.
import sklearn.preprocessing

scaled_data = sklearn.preprocessing.scale(numeric_data)
numeric_data = pd.DataFrame(scaled_data, columns=numeric_data.columns)

import sklearn.decomposition
pca = sklearn.decomposition.PCA(n_components=2)
principle_components = pca.fit_transform(numeric_data)
principle_components = pca.fit(numeric_data).transform(numeric_data)
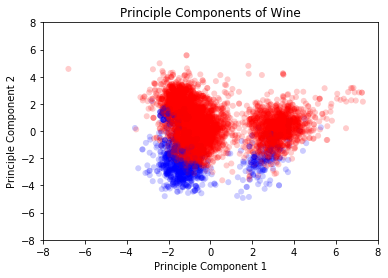
In this exercise, we will plot the first two principal components of the covariates in the dataset. The high and low quality wines will be colored using red and blue.
from matplotlib.colors import ListedColormap
from matplotlib.backends.backend_pdf import PdfPages
observation_colormap = ListedColormap(['red', 'blue'])
x = principle_components[:,0]
y = principle_components[:,1]

plt.title("Principle Components of Wine")
plt.scatter(x, y, alpha = 0.2, c = data['high_quality'],
           cmap = observation_colormap,
           edgecolors = 'none')
plt.xlim(-8, 8); plt.ylim(-8, 8)
plt.xlabel("Principle Component 1")
plt.ylabel("Principle Component 2")
plt.show()
Step 3
In this exercise, we will create a function that calculates the accuracy between predictions and outcomes.
def accuracy(predictions, outcomes):
    """
    Finds the percent of predictions that
    equal to outcomes
    """
    return 100 * np.mean(predictions == outcomes)
Because most wines in the dataset are classified as low quality, one very simple classification rule is to predict that all wines are of low quality. In this exercise, we determine the accuracy of this simple rule.
custom_prediction = accuracy(0, data["high_quality"])
print("Our custom prediction accuracy is: ", custom_prediction)
Our custom prediction accuracy is: 80.3447745113129
In this exercise, we will use the kNN classifier from scikit-learn to predict the quality of wines in our dataset.
from sklearn.neighbors import KNeighborsClassifier

knn = KNeighborsClassifier(n_neighbors = 5)
knn.fit(numeric_data, data['high_quality'])
library_predictions = knn.predict(numeric_data)

# evaluate accuracy
knn_accuracy = accuracy(library_predictions, data["high_quality"])
print("Using scikit learn KNN accuracy: ",knn_accuracy)
Using scikit learn KNN accuracy: 99.96921656148992