Python Data Science Toolbox - Part2
In this post your will be exposed to the following Python topic, which will be extremely helpful to build career as a Python developer or data scientist. This post mostly focuses on data science aspect. Topic Covered:
- Iterators
- List Comprehension and Generators
- Case study - based on what we learned.
# importing necessary modules
import pandas as pd
import numpy as np
import matplotlib.pyplot as plt
Iterators
an iterable is an object that can return an iterator, while an iterator is an object that keeps state and produces the next value when you call next() on it.
word = 'datascience'
it = iter(word)

# 1 alphabet at a time
print(next(it))

# print all at a time
print(*it)
d
a t a s c i e n c e
# Create a range object: values
values = range(10,21)

# Print the range object
print(values)

# Create a list of integers: values_list
values_list = list(values)

# Print values_list
print(values_list)

# Get the sum of values: values_sum
values_sum = sum(values)

# Print values_sum
print(values_sum)
range(10, 21)
[10, 11, 12, 13, 14, 15, 16, 17, 18, 19, 20]
165
enumerate() returns an enumerate object that produces a sequence of tuples, and each of the tuples is an index-value pair.
# enumerate
shopping_list = ['Shows', 'Pants', 'Shirt']

enu_shop = enumerate(shopping_list)

# let's turn enu_shop object into list
enu_list = list(enu_shop)
print(enu_list,'\n')

# let's unpack values using loop
for index, value in enu_list:
    print(index, " : ", value)
[(0, 'Shows'), (1, 'Pants'), (2, 'Shirt')]

0  :  Shows
1  :  Pants
2  :  Shirt
zip() function takes any number of iterables and returns a zip object that is an iterator of tuples. If you wanted to print the values of a zip object, you can convert it into a list and then print it.
# zip
x = [1, 2, 3]
y = [4, 5, 6]
zipped = zip(x, y)
list(zipped)
[(1, 4), (2, 5), (3, 6)]
tweet_data = pd.read_csv('data/tweets.csv')
tweet_data['lang'].describe()
count     100
unique      3
top        en
freq       97
Name: lang, dtype: object
# Define count_entries()
def count_entries(csv_file, c_size, colname):
    """Return a dictionary with counts of
    occurrences as value for each key."""

    # Initialize an empty dictionary: counts_dict
    counts_dict = {}

    # Iterate over the file chunk by chunk
    for chunk in pd.read_csv(csv_file, chunksize=c_size):

        # Iterate over the column in DataFrame
        for entry in chunk[colname]:
            if entry in counts_dict.keys():
                counts_dict[entry] += 1
            else:
                counts_dict[entry] = 1

    # Return counts_dict
    return counts_dict

# Call count_entries(): result_counts
result_counts = count_entries('data/tweets.csv', 29, 'lang')

# Print result_counts
print(result_counts)
{'en': 97, 'et': 1, 'und': 2}
List Comprehension and Generators
mylist = [2, 10, 5, 9, 12]

# if we want to create another list
# which is the square of 'mylist'
# we can do so by following

list_sqr = [sqr**2 for sqr in mylist]
print(list_sqr)
[4, 100, 25, 81, 144]
# another example
mylist2 = [i**3 for i in range(10)]
print(mylist2)
[0, 1, 8, 27, 64, 125, 216, 343, 512, 729]
# let's create a 4 by 4 matrix using comprehension
matrix = [[col for col in range(4)] for row in range(4)]

for row in matrix:
    print(row)
[0, 1, 2, 3]
[0, 1, 2, 3]
[0, 1, 2, 3]
[0, 1, 2, 3]
# conditionals in comprehensions
cond_list = [num ** 2 for num in range(11) if num % 2 == 0]
print(cond_list)
[0, 4, 16, 36, 64, 100]
# another conditional comprehension
con_list2 = [num ** 2 if num % 2 ==0 else 0 for num in range(11)]
print(con_list2)
[0, 0, 4, 0, 16, 0, 36, 0, 64, 0, 100]
# dictionary comprehension
dic_com = {i: i ** 2 for i in range(5)}
print(dic_com)
{0: 0, 1: 1, 2: 4, 3: 9, 4: 16}
# Example with string
student = ['hanif', 'ahmed', 'imad', 'fakri', 'ali']

dic_student = {key: len(key) for key in student}
print(dic_student)
{'hanif': 5, 'ahmed': 5, 'imad': 4, 'fakri': 5, 'ali': 3}
# Generator: it almost like comprehension but it won't store
# the value in the memory, it will just create a generator object

my_gen = (i ** 2 for i in range(5))
print('Generator object created\n',my_gen)
Generator object created
 <generator object <genexpr> at 0x0000026CB3F33D58>
# We can unpace it using loop
for i in my_gen:
    print(i)
0
1
4
9
16
# generator function
def gen_fun(n):
    i = 0
    while i < n:
        yield i
        i += 1
gen_num = gen_fun(7)

# generator object from generator function
print(gen_num)
<generator object gen_fun at 0x0000026CB3F01BF8>
Case Study
# let's read our world bank data
data = pd.read_csv('data/world_ind_pop_data.csv')

# first 10 rows of data
data.head(10)
| CountryName | CountryCode | Year | Total Population | Urban population (% of total) | |
|---|---|---|---|---|---|
| 0 | Arab World | ARB | 1960 | 9.249590e+07 | 31.285384 |
| 1 | Caribbean small states | CSS | 1960 | 4.190810e+06 | 31.597490 |
| 2 | Central Europe and the Baltics | CEB | 1960 | 9.140158e+07 | 44.507921 |
| 3 | East Asia & Pacific (all income levels) | EAS | 1960 | 1.042475e+09 | 22.471132 |
| 4 | East Asia & Pacific (developing only) | EAP | 1960 | 8.964930e+08 | 16.917679 |
| 5 | Euro area | EMU | 1960 | 2.653965e+08 | 62.096947 |
| 6 | Europe & Central Asia (all income levels) | ECS | 1960 | 6.674890e+08 | 55.378977 |
| 7 | Europe & Central Asia (developing only) | ECA | 1960 | 1.553174e+08 | 38.066129 |
| 8 | European Union | EUU | 1960 | 4.094985e+08 | 61.212898 |
| 9 | Fragile and conflict affected situations | FCS | 1960 | 1.203546e+08 | 17.891972 |
# no of rows
data.count()
CountryName                      13374
CountryCode                      13374
Year                             13374
Total Population                 13374
Urban population (% of total)    13374
dtype: int64
# converting column title into list

col_name = data.columns.values.tolist()
print(col_name)
['CountryName', 'CountryCode', 'Year', 'Total Population', 'Urban population (% of total)']
# let's take the first row from our dataset
# and create another list

first_row = data.iloc[0].tolist()
print(first_row)
['Arab World', 'ARB', 1960, 92495902.0, 31.285384211605397]
def list2dict(list1, list2):
    """
    This funtion will take two list as parameters
    and will return a dictionary
    """

    zipped_list = zip(list1, list2)
    return dict(zipped_list)


# lets call our list2dict with 2 lists
# we created from our dataset

print(list2dict(col_name, first_row))
{'CountryName': 'Arab World', 'CountryCode': 'ARB', 'Year': 1960, 'Total Population': 92495902.0, 'Urban population (% of total)': 31.285384211605397}
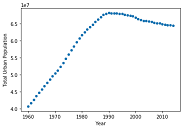
# Define plot_pop()
def plot_pop(filename, country_code):
# Initialize reader object: urb_pop_reader
urb_pop_reader = pd.read_csv(filename, chunksize=1000)
# Initialize empty DataFrame: data
data = pd.DataFrame()
# Iterate over each DataFrame chunk
for df_urb_pop in urb_pop_reader:
# Check out specific country: df_pop_ceb
df_pop_ceb = df_urb_pop[df_urb_pop['CountryCode'] == country_code]
# Zip DataFrame columns of interest: pops
pops = zip(df_pop_ceb['Total Population'],
df_pop_ceb['Urban population (% of total)'])
# Turn zip object into list: pops_list
pops_list = list(pops)
# Use list comprehension to create new DataFrame column 'Total Urban Population'
df_pop_ceb['Total Urban Population'] = [int(tup[0] * tup[1] * 0.01) for tup in pops_list]
# Append DataFrame chunk to data: data
data = data.append(df_pop_ceb)
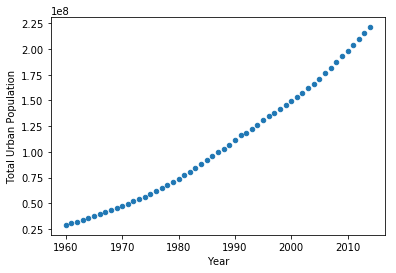
# Plot urban population data
data.plot(kind='scatter', x='Year', y='Total Urban Population')
plt.show()
# Set the filename: fn
fn = 'data/world_ind_pop_data.csv'
# Call plot_pop for country code 'CEB'
plot_pop(fn, 'CEB')
# Call plot_pop for country code 'ARB'
plot_pop(fn, 'ARB')